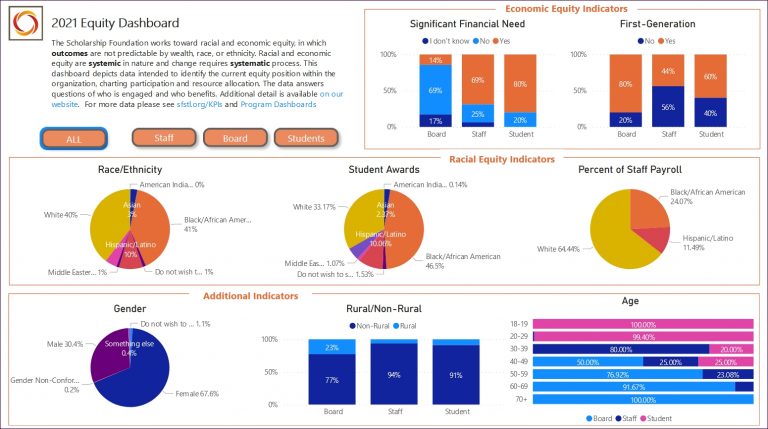
 We are a learning institution. For 102 years, we’ve professed belief in the power of higher education. Our foremothers understood that the right to learn and develop one’s thinking is an essential ingredient to democracy, to community. This week, we’ve released a new dashboard to examine the work of The Scholarship Foundation of St. Louis through an equity lens. In so doing, we are learning aloud, publicly, and with accountability.
In case you missed it, take a moment to review by clicking on these links:
Discussion and Data Definitions
Each link above also links to the other related components of the dashboard release. And each dashboard links to other dashboards, including our Key Performance Indicators and Program Dashboards. Explore freely, using the power of your mouse(pad)!
We’ve published this data with the hope that you will join our board and staff in learning. We are living out a mission we’ve held for more than a century, a belief that higher education is a community (and not just a private) cause. We know that the path to degree is fraught with roadblocks built by racism, classism, and ethnic and religious persecution. We were founded in the firm belief that good people, united in purpose and transparent in actions, can dismantle those barriers. We know from history and from our current condition as a society that educational opportunity can be a transformational force.
If you are reading this blogpost, you are part of The Scholarship Foundation family and invited to the table for discussion. As you read and click, ask yourself these questions, all of which have been raised by members of our board and staff in the last two years of development of this dashboard:
- What are the benchmarks or reference points we might use to measure our progress in advancing equity? Are they local, regional, statewide, or national? Do we measure against an index for all people or a subset, such as youth and/or those economically disadvantaged?
- Among the constituencies represented here (staff, board, students), are role definitions and goals consistent, similar, or different in representation and participation?
- What is the point of publishing this data in this way? What will we DO with what we learn?
I’d love to hear your thoughts and conclusions. Please reach out to me at faith@sfstl.org or 314-799-3547. We have so much to learn – all of us.
– Faith Sandler
SPECIAL THANKS to:
 Kenyana Savage 2021 Policy Fellow Kenyana Savage for her research on dashboards and metrics, recommendations for construction of the dashboards themselves, and her thoughtful and inspiring presentation to the staff and board. |
 Rob Foley, Director of Information Technology Director of Information Technology Rob Foley who designed and administered the data collection and depiction and built and rebuilt the dashboards with commitment to equity. |