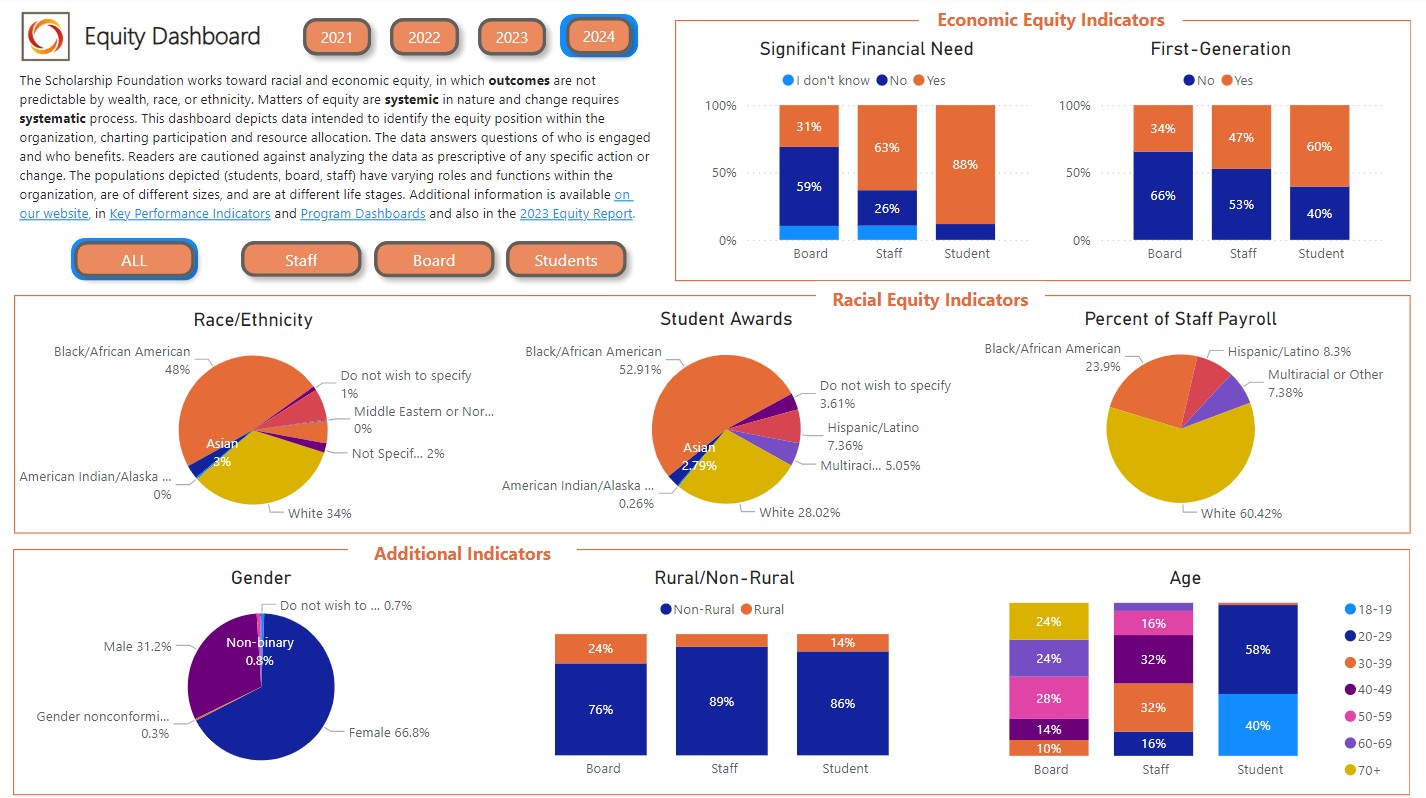
Equity Dashboard
The data depicted is true and transparently presented. It represents the most recently completed year of over 100 years of organizational history and development. The mission, values, and programs of the organization and its people are embedded in these outcomes.
Readers are cautioned against analyzing the data as prescriptive of any specific action or change. The populations depicted (students, board, staff) have varying roles and functions within the organization, are of different sizes, and are at different life stages.
The very purpose of The Scholarship Foundation at its founding in 1920 was to provide educational opportunity as a means of advancing economic equity, essential in a developing democracy. The organization was born in a time of terrible persecution on the grounds of race and religion. Addressing inequity remains a core value.
DATA COLLECTION AND SOURCES
- Sources: Where possible, data on identity characteristics are self-reported and not assumed or assigned. Exceptions are limited to zip code and financial data pulled from supporting materials submitted by applicants.
- Population Size: Comparisons among groups may be made, but caution is warranted when drawing conclusions. Among the groups, population size and role vary and one or two responses may shift findings significantly.
- Collection Method: The data reported here are collected through an annual survey administered to all members of the board and staff, information derived from student-submitted applications and supporting materials, and from the disbursement records of The Scholarship Foundation in the case of awards to students a staff payroll.
INDICATORS
ECONOMIC EQUITY
- Significant Financial Need is a measure of the economic condition of individuals in their formative or pre-collegiate years. Student data are derived from application materials and use “Estimated Family Contribution” from FAFSA completion (or equivalent) as proxy for federal Pell Grant eligibility. Board and staff-data are self-reported and derive from survey responses regarding whether they were eligible for federal financial aid in earlier years.
- First Generation depicts those who grew up in families in which theirs was the first generation to attend college. The data are self-reported for all groups.
RACIAL EQUITY
- Race/Ethnicity is self-reported for all groups, with respondents provided categories consistent with U.S. Census questions. Race and ethnicity are optional questions on the student application.
- Student Awards provides a depiction of the distribution of annual financial awards made by The Scholarship Foundation in the form of scholarship grants and/or interest-free loans by race and ethnicity.
- Staff Payroll depicts total annual salaries paid to all staff, by race and ethnicity.
ADDITIONAL
- Gender is self-reported for all groups.
- Rural/Non-Rural is collected by survey from board and staff in response to a survey question regarding the area in which they grew up (and not where they presently reside). Student data are assigned by zip code to these designations, based upon categories derived from United States Census geographic designations.
- Age is self-reported at the time the respondent completed the application or answered the survey.
To view the Equity Dashboard, click the image above or go to sfstl.org/equity


