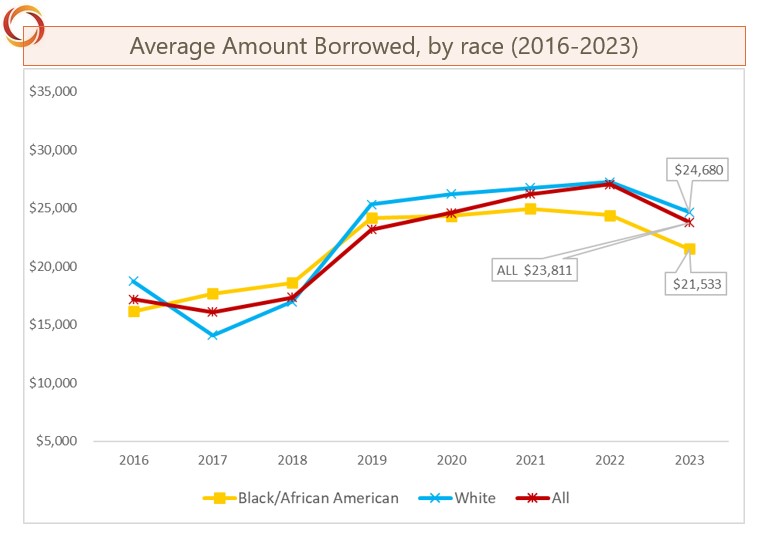
This graph, excerpted from The Scholarship Foundation 2023 Equity Report, depicts total balances graduates of that year owed to The Scholarship Foundation. Starting with students first applying in 2015 (graduating class of 2019), Scholarship Foundation awards were “last dollar” and students did not have to borrow from other sources. This is one of 42 graphs available in the dashboards and equity report released by the Foundation annually.
In the midst of it all, let’s not forget that a more compassionate and equitable approach to higher education access and success IS within reach. If like me you need a break from all that has gone wrong, please spend a moment learning what The Scholarship Foundation is making right.
Our data dashboards for 2023 have now been published to the website and you can find them here:
But wait, there’s more! At the request of the board and in preparation for our next strategic plan, we have built a brand new equity report which disaggregates by race, class, and gender and provides benchmarks drawn from comparable national data. Learn more by clicking the link below:
And just in case you prefer words to numbers, here is a summary of what is possible and proven by the students of The Scholarship Foundation of St. Louis.
PROOF POINTS
STUDENT IDENTITY:
Two-thirds of the Foundation’s funded students identify as female.
Two-thirds of the Foundation’s funded students do not identify as white.
LOANS AND GRANTS:
Scholarship Foundation students borrow lesser average amounts than all students nationally and in lesser proportion.
Since 2016, the proportion of Foundation students awarded loans has decreased by 58 percentage points as scholarship grant funding has increased commensurately.
In 2023, approximately one-third of Foundation students were borrowing to finance their education. For one-quarter of all students funded by the Foundation, the interest-free loan is “last dollar” after the Foundation has awarded that student a scholarship grant.
STUDENT FINANCES:
In 2023, families of Foundation students could afford to pay an average of just $2,400 per year toward their student’s cost of college attendance.
Average annual cost of attendance for Foundation students in 2023 was $32,000.
Among the 527 students the Foundation funded in 2023, the average annual gap that remained was $13,000 after family, state, federal, and school aid were applied. The Foundation filled the gaps with $1.3 million in interest-free loans and $4.6 million in grants.
RACIAL EQUITY AND DEBT:
Compared to all U.S. students, Scholarship Foundation students borrow less frequently and among those who do have loans, their annual and cumulative debt is less than all students nationally.
While nationally Black students borrow with greater frequency and in larger average amounts than white students, this is not the case at The Scholarship Foundation where black students are borrowing, on average, $3,100 less per year than white students.
RACIAL EQUITY AND DEGREES:
Scholarship Foundation students graduate at higher rates than all students of all income levels nationwide.
Annually, 35% of those graduating and funded by The Scholarship Foundation identify as Black. Nationally, Black students are completing degrees at a rate of 10%.
Numbers can tell a story, though not often the whole story. Achieving these more equitable outcomes requires remarkable data systems, significant community support, an engaged and high functioning board, and a staff that puts both heart and head into the work. After almost 34 years, I still feel lucky each day I get to contribute to proving what’s possible.
– Faith Sandler