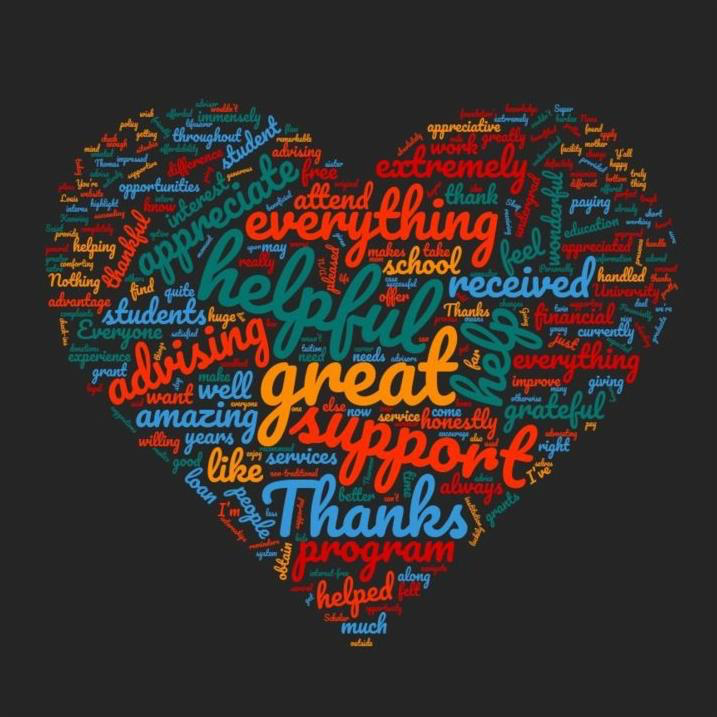
Our board and staff are planning for a strategic planning session in which we will begin setting vision and goals for our centennial year and beyond. In doing so, we administered a survey to current and recent students and asked some open-ended questions for feedback about what we do and how we do it. The valentine (depicted above) simply configures the words used most often in their responses. This, after all, is the best love note we could get.
And then, beyond the expressions of emotion, there’s data. Our key performance indicators and program dashboards have been updated to report 2018. Please feel free to click on either link and explore the data to draw your own conclusion, but here’s what makes me especially proud:
- We continue to seek and serve students with significant financial need. Just under 80% of our students also qualify for the federal Pell Grant, a program reserved for the very neediest only. The average amount our students’ families can theoretically contribute annually to cost of education (“Estimated Family Contribution”) is just $2,800. The average financial gap between the cost of attendance and all other resources (family, school, state, and federal) our students have assembled is $10,000.
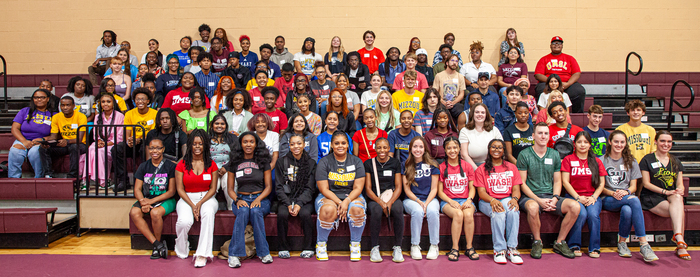
- Scholarship Foundation students represent the diversity of students with need in the region. About half our students report they are from households where no prior generation attended college. A full 57% of our students identify as students of color (African American, Latinx, or multi-racial). Our students come from an increasingly broad geographical area; while 75% are from St. Louis City and St. Louis County, the remainder are from more remote metro counties in Missouri and Illinois and from as far south as New Madrid and as far west as Jackson and Greene counties.
- We are filling the gap, helping more. In the last year, we awarded 503 students, an 11% increase over 2017. Even more importantly, in that same year our average interest-free loan increased 8% and our average scholarship grant increased 22% over the prior year.
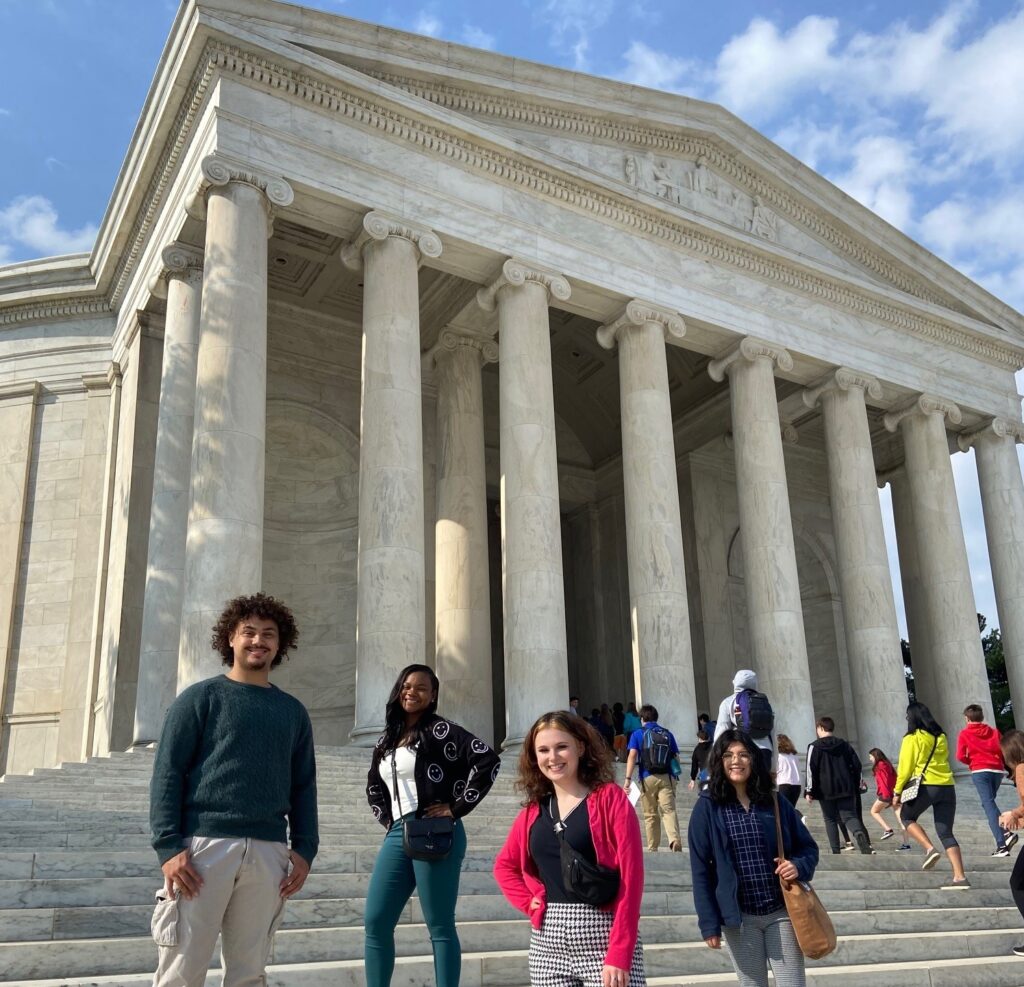
- Our students are succeeding at the goals they set for themselves.The majority of our students attend public universities in their home state, and most have chosen degree programs with specific employment outcomes; nursing, engineering, business, and education top the list, in that order. Our students are graduating at a rate considerably higher than the national average for students of all economic strata, and more than five times higher than the average for similarly low-income students.
In 2020, The Scholarship Foundation will celebrate 100 years, with pride and with purpose. We’ll count the years, total the students, estimate the dollars. We’ll thank a generous community we count on to support the next generation of learners. And we’ll remember that we do work that counts, because our students have told us so (with love).
– Faith Sandler
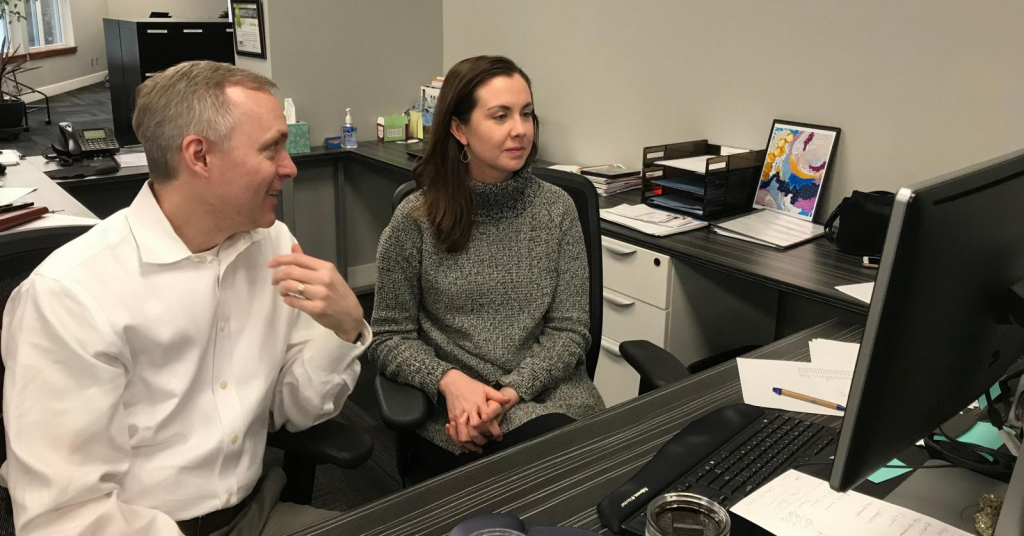
P.S. I’m the bearer of good news here, but please take a minute to meet IT Director, Rob Foley and Data Support Specialist, Laura Keeton. This dynamic duo designs our systems, maintains our data, and helps hold us accountable to the community and to our students. They’ve designed these dashboards, but they’ve also done the work to position us to report KPIs consistently. They are no-nonsense and truly rock!