Each year, Scholarship Foundation Key Performance Indicators and Program Dashboards are updated to demonstrate how the financial support, provided by many generous donors and awarded by hard-working staff, translate to success for the students who are funded and supported by The Scholarship Foundation. The 2020 year was extraordinary, replete with unusual challenges to say the least. The data reflect these challenges, but the data also tell a story of remarkable success in overcoming those challenges:
- Grant awards set a new $2.5M record – Economic concerns for students led a reduction in the number of interest-free loan awards made in 2020, while an outpouring of financial support from donors and program sponsors provided an increase in available grant aid. For the first time in The Scholarship Foundation’s 100-year history, the amount of grant aid provided to students exceeded the amount issued in loans.
- Emergency Microgrants: In 2020, The Scholarship Foundation awarded $49,429 in microgrants to 74 students to address emergency needs caused by the COVID-19 pandemic. These small grants resulted in the reduction in computed average grant per student for 2020. Had these microgrants not been made the average grant would be $8,352, up from the 2019 average of $8,167. The quick action of donors and staff to put these microgrants in the hands of students helped many overcome obstacles and avoid further disruption to their educational plans.
- The gap between cost of attendance and institutional aid continues to grow. This national trend is reflected in the data as well. The average cost of attendance for Scholarship Foundation students increased again to over $30,000 per student. At the same time, the average Expected Family Contribution (EFC) remained consistently very low, and the average institutional grant aid decreased in 2020 leading to the largest single year increase (11%) in unmet need in recent years.
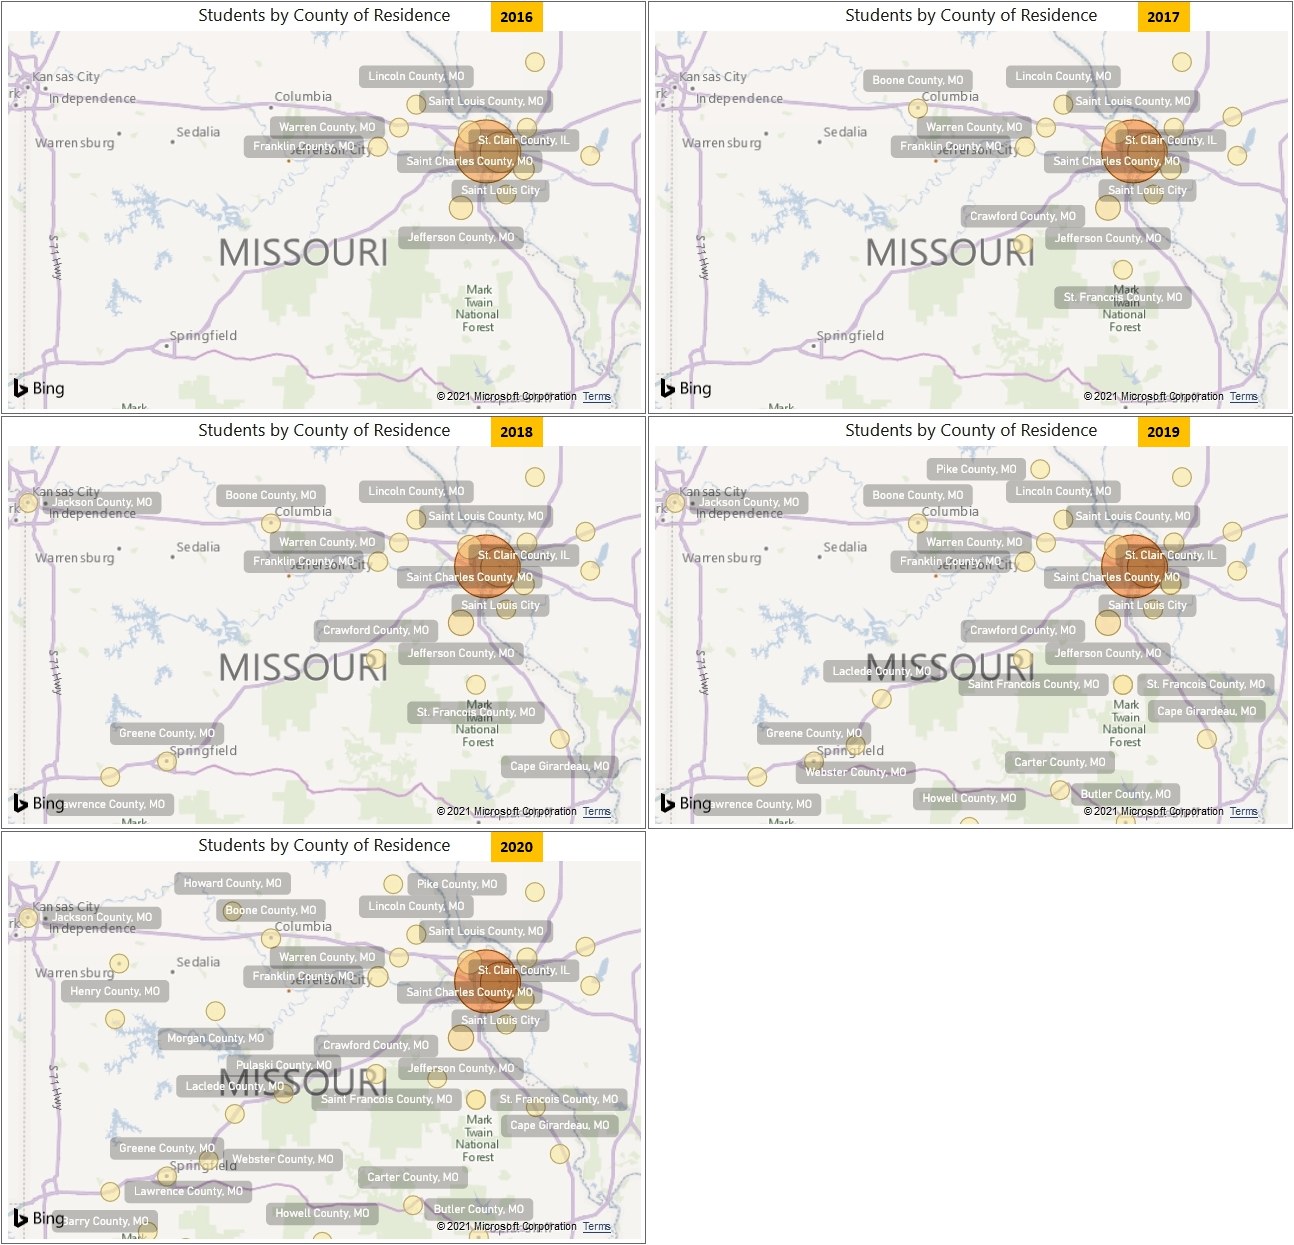
- The organization’s reach expanded further across the region – With the growth of several important programs to meet the needs of students from rural communities, the map of Foundation students by county of residence shows a continued expansion of services across the bi-state region:

Data has been depicted in this readily available, interactive format on the Foundation’s website for five years as part of the organization’s ongoing commitment to accountability and transparency. This year 2020, though extraordinary in many ways, was no different in this regard. Please feel free to explore the data further. Any questions or comments make be directed to rob@sfstl.org
– Rob Foley, Director of Planning and Technology


